


In 2006, three University of Michigan researchers—Claes Fornell, Forrest Morgeson, and M. S. Krishnan—along with University of Maryland professor Sunil Mithas, published “Customer Satisfaction and Stock Prices: High Returns, Low Risk” in the Journal of Marketing, the flagship journal of the American Marketing Association.
The paper examined data from the American Customer Satisfaction Index (ACSI), a proprietary index that measures customer satisfaction with major U.S. companies, and asked whether changes in those scores could be used to predict stock returns.

ACSI itself had been created at the University of Michigan in 1994 by a research team led by Claes Fornell, the lead author of the 2006 paper. In other words, Fornell was not an outside researcher testing someone else’s dataset. He created the metric whose ability to beat the market he was now studying.
The paper claimed that a trading strategy based on ACSI customer-satisfaction data had outperformed the S&P 500 every year tested, by a substantial margin.
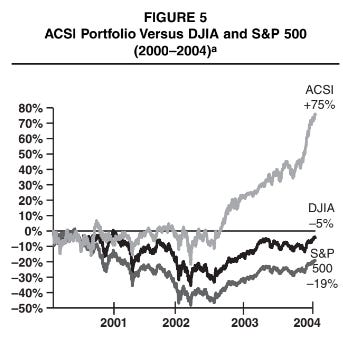

That is an extraordinary claim.
Persistent, market-beating returns with lower risk are essentially the holy grail of investing. If the researchers had really discovered a durable source of alpha, the obvious question was why they were publishing it in a marketing journal rather than raising money and trading on it.
As it turns out, that is eventually exactly what they did.
There was just one problem: it didn’t replicate.
WATCH THIS INVESTIGATION ON YOUTUBE:
First Failed Replication
The first major challenge came in 2009, when Christopher Ittner of Wharton and David Larcker and Daniel Taylor of Stanford published a commentary in Marketing Science reexamining whether ACSI data could actually be used to earn abnormal stock returns.
I reached out to this research team, and Daniel Taylor—the Arthur Andersen Chaired Professor at the Wharton School and director of the Wharton Forensic Analytics Lab—provided me with a direct assessment.
I am sure you are aware of (A) Gelman’s “Garden of Forking Paths,” (B) Data Colada’s “False Positive Psychology,” and (C) the Problem of Overfitting. Fornell et al. didn’t run standard multifactor asset pricing tests; didn’t use standard t-tests; and didn’t conduct out of sample tests. When you do, there is nothing there.
I don’t expect someone who is monetizing ACSI for their benefit to be able to conduct an unbiased study on the predictive value of ACSI scores. This is not unique to ACSI. I’d have the same criticism for academic studies of ESG and CSR where the author has a significant ESG/CSR consulting practice. Occasionally academics use journal publications as marketing tools to boost their existing consulting practice. That’s fine. But we shouldn’t pretend the publication presents an unbiased view.
Strictly speaking, this was not a line-by-line replication of the original paper. It was arguably more damaging: a methodological reexamination showing that the headline result was highly sensitive to the unusual choices used to produce it.
Using what they described as more conventional methods from the accounting and finance literature, they found that the market appeared to incorporate major changes in customer satisfaction relatively quickly.
They also took aim at the peculiar construction of Fornell’s original trading strategy: the 2006 paper went long companies whose ACSI scores were above their competitors and had increased by at least two points, while taking short positions in companies whose scores were below competitors and had declined by at least two points. Ittner and his coauthors noted that Fornell et al. never explained why they chose the “arbitrary two-point cutoff.” They also pointed out that the long-run investment strategy combined ACSI levels with this arbitrary threshold, while the paper’s own short-term event study used a different methodology altogether.

When Ittner, Larcker, and Taylor instead sorted firms using changes in ACSI and tested more standard equal- and value-weighted portfolios over roughly three-month, six-month, and one-year holding periods, the spectacular returns disappeared. Moreover, the portfolio containing companies with the largest increases in customer satisfaction did not significantly outperform the portfolio containing those with the largest declines.
The authors then brought up the allegation of “aggressive data mining” — if the 2006 paper experimented with enough variables, thresholds, and definitions, eventually some strategy may appear to beat the market simply by chance.

Their bottom line was unusually clear: They found “no evidence that ACSI information can be used to earn abnormal long-run returns” and also that “we find no evidence that ACSI levels are associated with short-term returns.”
Second Failed Replication
A second challenge arrived the same year. In 2009, Robert Jacobson and Columbia Business School professor Natalie Mizik published “The Financial Markets and Customer Satisfaction: Reexamining Possible Financial Market Mispricing of Customer Satisfaction” in Marketing Science.
When Jacobson and Mizik reexamined the relationship using alternative portfolio constructions and risk-adjustment methods, they found that the supposed ACSI anomaly was “not widespread across the market.”
Instead, the statistically significant results were concentrated in just ten computer and Internet companies—including Apple, Dell, Amazon, eBay, Google, Yahoo!, and Hewlett-Packard—which together accounted for only 8 percent of the sample observations. Once those firms were separated from the rest of the sample, there was no statistically significant relationship between customer satisfaction and future abnormal stock returns.
This distinction was crucial. The 2006 paper presented ACSI as evidence of a general market inefficiency. Jacobson and Mizik found something much narrower. The apparent anomaly was concentrated in a tiny group of technology and Internet stocks during the unusual 1995–2006 period encompassing the dot-com boom, bust, and aftermath.
Their conclusion was blunt: the alleged mispricing was “not widespread,” was “limited to firms in the computer and Internet sector,” and might “not be directly related to a customer-satisfaction based anomaly” at all. Instead, it could simply reflect the peculiar behavior of technology stocks during the dot-com era.
I reached out to Dr. Natalie Mizik, now a professor at the University of Washington, who gave me an extraordinary account of what happened behind the scenes.

Mizik said her team had gone considerably further than the version of their paper that was ultimately published. An earlier version, she told me, contained additional replication tests that “show[ed] step-by-step exactly why the early ACSI studies showed significant effects when there are none.” According to Mizik, that paper had already survived peer review, been accepted, and reached the page-proof stage when something unusual happened.
“From what I understand, Fornell (et al. ?) complained to the editor about our paper and the editor decided to reject this paper from the journal after it was accepted by [the] previous editor and was post-page proof stage and almost ready to be published.”
A substantially different version was eventually published.
Here are the two versions side by side:
The version that was eventually published in Mktg Sci with commentaries, including one by Ittner, Larcker, and Taylor, does not have the “Valuation of ACSI” (i.e., Value-relevance of ACSI) results, which I think are more important for mktg field (showing that any positive effects of improved customer satisfaction are fully incorporated into the current earnings and when you include current earnings surprised into the Return model, the ACSI metric itself does not have any incremental “value,” except in computer and internet sector, see p. 22 in .ppt). It only reports the “Mis-Valuation of ACSI” results, which is what you are interested in?
The reason(s) we didn’t find anything in the data were faulty estimation methods and data management (a handful of firms in the Internet sector driving sig results) in the early ACSI studies. And I have been puzzled and have no explanation as to why we were able to replicate the exact point-estimates, but got lower (and non-sig) T-stats compared to Aksoy et al. (2008) ACSI mispricing findings, see bottom of p. 815 and Footnote 2 in Jacobson and Mizik (MktgSci 2009). We followed their protocols for portfolio formation and had presumably the same data.
I have attached a .ppt I used for a presentation at NYU in 2007. It might be easier to follow to see how sig results are driven by a handful of Computer and Internet firms in the valuation and in the mis-pricing studies.
This [article] from 2013 about bottom-ACSI firms outperforming might be answering your question of why ACSI ETF underperforms:
I do not know what the exact portfolio formation rules are for ACSI ETF and whether past errors in the methods can explain their underperformance. The ACSI website says it is based on top ACSI score in the sector (but there might be something else they are doing and not disclosing the (minor) details, e.g., how sectors are defined, etc.) If it is just the level of ACSI, you can see on .ppt page 23 that the top and bottom 25% portfolios based on lagged ACSI scores have sig positive returns in the computer and internet sector. These results are not in the Mktg Sci paper because we tested the Aksoy ACSI portfolios with joined high ACSI + top ACSI growth rules.
She then pointed me toward an extraordinary episode I had missed: in 2003, the Wall Street Journal reported that Fornell had personally traded on privileged, nonpublic ACSI data before the scores were released to the public.
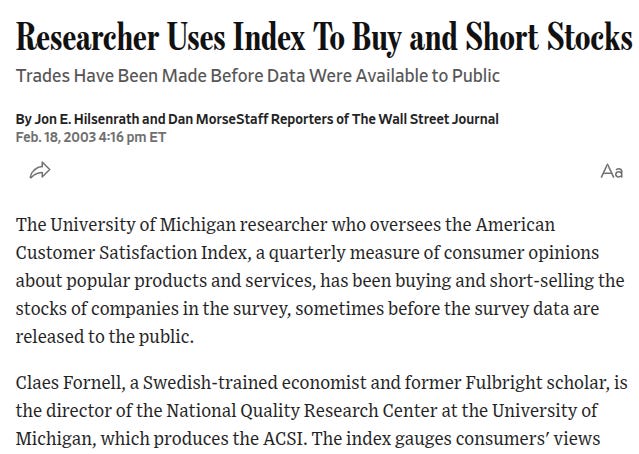
“It’s inappropriate for a public university to hold important information from the public,” said Mercer Bullard, a former assistant chief counsel at the SEC.
The University responded to the incident by stating its intent to investigate the situation according to University policies.
Business School Dean Robert Dolan also issued a written directive:
“I have instructed anyone affiliated with the ACSI not to make personal use of the information gathered in the course of producing the quarterly index, prior to the index’s release to the general public.”
Fornell said he would comply. From that point forward, he would no longer trade stocks covered by the ACSI before the index results were publicly released.
Third Failed Replication
The third replication is arguably the most direct. In 2009, Don O’Sullivan, Mark Hutchinson, and Vincent O’Connell published “Empirical Evidence of the Stock Market’s (Mis)pricing of Customer Satisfaction” in the International Journal of Research in Marketing.
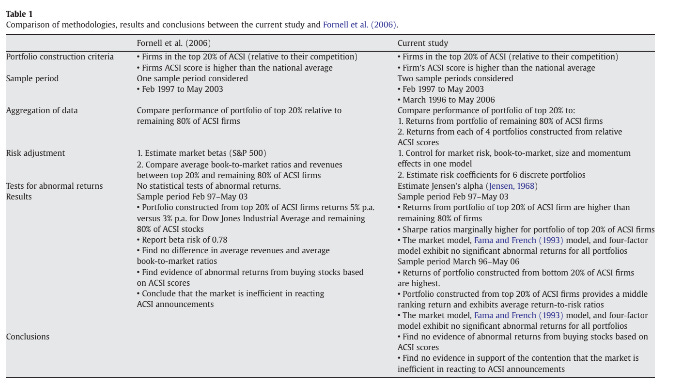
Unlike Jacobson and Mizik, they specifically went back and tested the actual trading strategy proposed by Fornell et al. (2006). They used the same February 1997–May 2003 sample period and essentially the same portfolio-construction rules, but subjected the strategy to standard asset-pricing tests that the original paper had not performed. They adjusted returns for market risk, size, value, and momentum and formally tested whether the portfolios generated statistically significant abnormal returns using Jensen’s alpha.
The result was devastating.
The original Fornell paper had reported that its high-ACSI portfolio beat both the market and other ACSI companies. But O’Sullivan and his coauthors found no statistically significant abnormal returns under the market model, Fama-French model, or four-factor model. Their comparison table is explicit: Fornell et al. found “evidence of abnormal returns”; but this replication found “no evidence of abnormal returns.”
Even worse, they found the opposite conclusion: when the researchers then extended the sample through May 2006, the relationship started running in the wrong direction. The portfolio containing the bottom 20% of companies by ACSI score produced the highest returns.
And that was before accounting for trading costs. O’Sullivan et al. noted that roughly 70% of the ACSI portfolio had to be rebalanced every year, meaning brokerage costs, bid-ask spreads, and market impact would make the strategy look even worse in the real world.
Fourth Failed Replication
And there’s an extraordinary punchline from Bell, Ledoit & Wolf’s 2014 replication, “A New Portfolio Formation Approach to Mispricing of Marketing Performance Indicators: an Application to Customer Satisfaction.”
Since one of the main criticisms of Fornell et al. was that they didn't test their strategy out of sample, this group tested ACSI-based strategies over 156 out-of-sample months from 1996/1997 through 2009, using multiple definitions of customer satisfaction and both annual and quarterly portfolio rebalancing.
The result was another failure.
With annual rebalancing, none of the t-statistics even exceeded 1.0, and the best annualized Sharpe ratio was below 0.25. With quarterly rebalancing, performance improved somewhat, but the strongest t-statistic was only about 1.8 and the best Sharpe ratio about 0.47—still short of either statistical or economic significance.
Then Bell and his coauthors performed an especially brutal robustness check: they gave their trading strategy perfect foresight of future ACSI scores. In other words, the portfolio got to know in advance which companies’ customer-satisfaction scores were about to rise or fall—information that an actual investor could not legally or practically possess.
Even that didn’t work. Not a single return was statistically significant, and the highest Sharpe ratio was below 0.32. As the authors put it, if even an “insider” trading strategy using future ACSI scores could not generate profitable portfolios, it was difficult to argue that customer satisfaction was being systematically mispriced by the stock market.

Their final conclusion was unambiguous: “We fail to find any convincing evidence for mispricing of customer satisfaction” and “There is no evidence for mispricing based on either statistical or economic significance.”
Fornell Doubles Down
It is rare enough for an academic paper to make an extraordinary claim that later fails repeated replication attempts. Rarer still is for the same researchers to return a decade later, in the same journal, and publish an even more extraordinary version of the original claim.
In 2016, Claes Fornell and Forrest Morgeson, now joined by G. Tomas M. Hult, returned to the Journal of Marketing with a paper: “Stock Returns on Customer Satisfaction Do Beat the Market.”
The paper explicitly presented itself as an answer to the failed replications. Fornell and his coauthors argued that enough time had now passed to settle the dispute empirically. If the critics were right, they reasoned, the extraordinary returns associated with their customer-satisfaction strategy should have disappeared as more out-of-sample data accumulated.
Instead, they claimed that the opposite had happened.
This is where, in my view, the evidence begins to raise the possibility of outright fraud.
The authors claimed that their ACSI trading strategy resulted in 518% returns versus just 31% for the S&P 500 over 15 years.
A fantastical result. An unbelievable result.
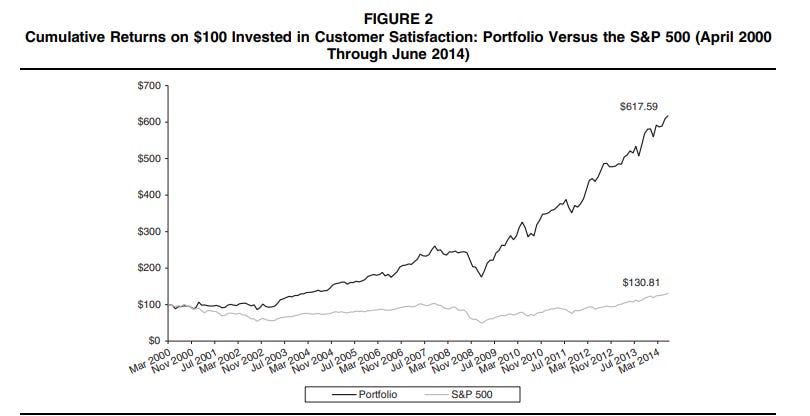
Their trading strategy that supposedly produced these 518% returns had one extraordinary catch: it was secret.
The evidence came from an actual investment fund founded and owned by Fornell himself — who acknowledged that the fund “does not include formulaic trading rules,” meaning the crucial investment decisions were discretionary and undisclosed. Without knowing the rules for stock selection, position sizing, timing, turnover, risk controls, and other trading decisions, outside researchers cannot reconstruct the portfolio. And if they cannot reconstruct the portfolio, they cannot determine whether customer satisfaction actually generated the extraordinary returns.
Even That Didn’t Replicate! Three More Times!
Fornell’s 2016 victory lap — where he claimed to achieve 518% returns, vs. just 31% for the SP500 — c’mon — did not end the controversy.
In the very same issue of the Journal of Marketing, two separate teams published responses questioning whether his extraordinary returns could actually be attributed to customer satisfaction.
Sundar G. Bharadwaj and Debanjan Mitra, in “Satisfaction (Mis)pricing Revisited: Real? Really Big?”, argued that Fornell, Morgeson, and Hult had still not resolved the theoretical and empirical problems necessary to establish customer satisfaction as a genuine asset-pricing anomaly.
This paper identifies many “caveats that could affect the robustness of [Fornell’s] conclusion.”
The results critically depend on the manner in which industry is defined.
Because Fornell, Morgeson, and Hult use a proprietary trading strategy that has not been disclosed to the general public, the authors are unable to discern what fraction of their reported performance is due to customer satisfaction as opposed to other characteristics of the trading strategy.
Because the authors also find positive abnormal returns for the entire American Customer Satisfaction Index sample, at least some of the performance reported by Fornell, Morgeson, and Hult might be driven by sample characteristics unrelated to customer satisfaction.
Fornell, Morgeson, and Hult do not consider alternative theoretical bases of their mispricing results.
Fornell, Morgeson, and Hult combine satisfaction and change in satisfaction. They indicate that stocks were purchased both before and after the ACSI announcement.
Fornell, Morgeson, and Hult’s results are based on a small number of firms
that are selected arguably not at random. Often it is not clear
how ACSI chooses to include or exclude firms.
More damaging was the next paper, “Customer Satisfaction and Long-Term Stock Returns,” by Texas A&M professors Alina Sorescu and Sorin M. Sorescu.
Their analysis could not reproduce Fornell’s spectacular fund performance because his “proprietary trading strategy had not been disclosed to the general public. Therefore, we are not able to discern what fraction of the performance reported by [Fornell] is due to customer satisfaction” as opposed to whatever else was hidden inside the secret trading strategy.

The failures did not stop there.
In 2020, Ashwin Malshe, Anatoli Colicev, and Vikas Mittal revisited Fornell’s results in How Main Street Drives Wall Street: Customer (Dis)satisfaction, Short Sellers, and Abnormal Returns.
After reviewing the literature, the authors concluded that the relationship between customer satisfaction and abnormal returns was “not as well established as some may believe,” noting that prior studies had found positive, zero, and negative results.
Malshe and his coauthors went considerably further than a simple portfolio comparison. The econometric procedure was:
They split the sample into firms for which ACSI scores were reported and firms for which they were not.
They then re-estimated their full “main model” separately on each subsample.
The estimator was a multiple-equation Conditional Mixed Process (CMP), a maximum-likelihood framework that jointly models their selection equation, short interest equation, and abnormal-return equation. The main paper says CMP accommodates correlated errors across equations, different dependent-variable types, selection correction, and multilevel effects.
They used heteroskedasticity-corrected standard errors.
They did not simply use raw levels. Their main specification transforms variables into “unexpected changes” using AR(1) models and uses the residual innovations in the econometric model.
They also use control-function corrections for potential endogeneity, based on peer-of-peer instruments, plus a battery of controls.
The final result really is ugly for ACSI. In Table W19, for firms covered by ACSI, customer satisfaction has a coefficient of −0.0062 (SE .006) on short interest and customer dissatisfaction 0.0212 (SE .019)—neither statistically significant. More importantly, the direct coefficients on abnormal returns are also nonsignificant: customer satisfaction is 0.0034 (SE .060) and dissatisfaction is 0.0738 (SE .155).
The authors conclude:
“Importantly, the effect is nonsignificant for firms covered in the ACSI.”

That goes directly at the heart of Fornell’s claim. His 2006 and 2016 papers argued that customer satisfaction, measured using ACSI, could generate abnormal stock returns and beat the market. Yet, using newer data and more well-identified econometric methodology, Malshe and his coauthors found no statistically significant effect.
Their appendix is actually far more damaging to Fornell than the main paper. Rather than merely discussing the mixed replication literature, it directly asks the question that matters for Fornell’s investment thesis: does an ACSI-based strategy actually generate abnormal returns?
The answer is overwhelmingly negative.
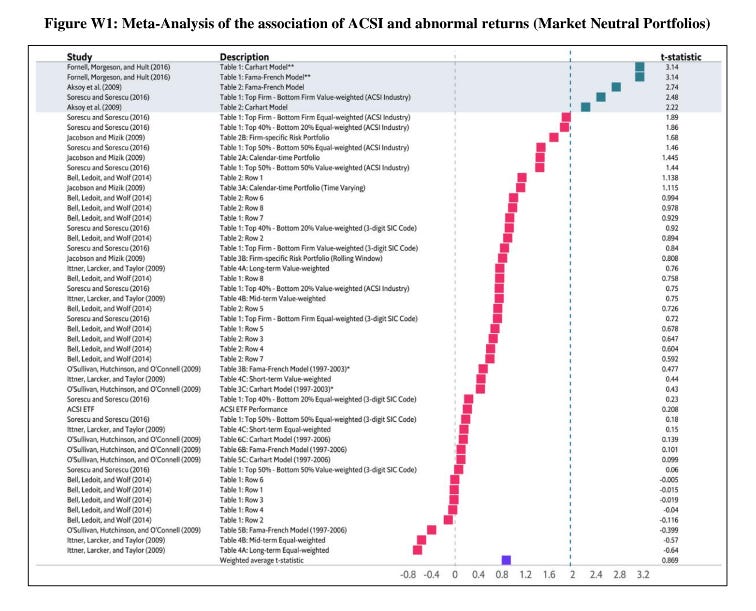
The authors assemble 49 market-neutral estimates from eight studies. The average t-statistic is just 0.869, and only five of the 49 estimates are positive and statistically significant at the 5% level. Against that backdrop, Fornell, Morgeson, and Hult’s 2016 finding looks less like a representative result than a glaring outlier. They reported 0.9% alpha per month with p ≤ .001—and the appendix explicitly notes that this is by far the largest outlier reported anywhere in the literature.
The entire literature says the opposite of what Fornell et al. says.
Commercialization
Then the fatally flawed academic claim became a financial product.
The timing is remarkable:
August 5, 2016: the ACSI ETF prospectus is filed with the SEC. It states that “Mr. Claes Fornell has a controlling interest in the Adviser and ACSI.”
September 1, 2016: Fornell, Morgeson, and Hult publish “Stock Returns on Customer Satisfaction Do Beat the Market,” claiming that their trading strategy generated 518% returns.
October 31, 2016: The ACSI ETF launches.

Fornell’s ACSI ETF charged a 0.65% annual management fee, compared with an average of 0.14% for other similar ETFs, making ACSI roughly 4.6 times more expensive than the industry average… meaning a claim that had not survived replication was now being marketed as an investment strategy, with investors paying a substantially inflated premium to access it.
Investors are paying through the nose for a financial product built on research that appears to be fraudulent junk science.
ACSI ETF Underperforms the S&P 500
Nearly ten years after its launch, we can now test the commercial version of the ACSI thesis against actual market performance.
The results look remarkably different from the academic claims.
Remember: in 2016, Fornell, Morgeson, and Hult reported that their customer-satisfaction trading strategy had generated 518% in cumulative returns, compared with just 31% for the S&P 500, with estimated annual alpha of roughly 8% to 11%.
Then the ACSI ETF launched.
According to the fund's own website, from its October 31, 2016 inception through July 31, 2026:

Rather than beating the S&P 500 by 8-11%per year, the actual ACSI ETF has lagged it by roughly 2.6% per year since inception. Thus, nearly a decade of live, out-of-sample performance shows that Fornell’s ACSI thesis has not held up: the financial product built around it underperformed the market, exactly as the replication literature predicted.
One replication in particular examined the ETF almost immediately after launch. In the 2020 Journal of Marketing Research appendix discussed above, Malshe, Colicev, and Mittal explicitly treated the ACSI ETF as a real-world test of Fornell, Morgeson, and Hult’s 2016 strategy. They contrasted the paper’s claimed 0.9% monthly alpha with the ETF’s actual performance and concluded that it had generated “0% abnormal return before fees.” After accounting for the fund’s expense ratio, they wrote that “the strategy is losing money.”

So, even six years ago, the failed ACSI ETF performance was already glaring.
Today, that early warning has hardened into a decade-long track record of failure.
Journal of Marketing Responds
According to multiple experts I spoke with, problems with this research have been known within academic marketing for years. But a decade ago, researchers were far less willing to openly discuss the possibility of serious research misconduct than they are today. Cases such as Francesca Gino at Harvard and Dan Ariely at Duke have fundamentally changed that conversation.
What makes the ACSI story especially serious is that the stakes extend far beyond the academic literature. If the underlying research is ultimately shown to involve serious misconduct, then potentially unreliable findings did not merely accumulate citations—they helped underpin a commercial investment strategy and a broader business built around the claim that customer satisfaction can predict superior stock returns. Today, more than $100 million is invested in an ETF whose intellectual foundation rests on those claims.
Several marketing scholars I have spoken with privately believe the relevant papers warrant retraction or formal investigation. I have contacted the Journal of Marketing editorial board to initiate that process.
At minimum, the Journal of Marketing and the institutions involved should now conduct a formal review of the underlying data, methods, disclosures, and conflicts of interest. Investors, researchers, and the public deserve to know whether a lucrative financial product was built on a fatally flawed academic claim—and whether its creators sold investors on that claim after serious doubts about its validity were already impossible to ignore.
I have heard that the new Editor, Jan-Benedict Steenkamp, is high on data accuracy and has set up several scholars to act. I contacted him with an advance copy of this article and asking if they would open an investigation or retract Fornell’s papers. He responded:
“I will discuss this with my co-editors and the VP publications. We have a lot on our plate, and I cannot promise you when we have the time to do this, and when we will respond.
…
AMA follows COPE guidelines in these cases, the most significant difference is how the American Marketing Association executes the suggested guidelines is that the Vice President of Publications leads investigations rather than the individual journal editor,”
I also want to flag what seems like a direct conflict between the Journal of Marketing’s current standards and the Fornell et al. (2016) paper. In their March 25, 2026 editorial, “Cementing JM’s Impact on the Marketing Ecosystem: Empirical Execution,” they wrote:
Replicability is the hallmark of science. “Scientific claims should not gain credence because of the status or authority of their originator but by the replicability of their supporting evidence. Even research of exemplary quality may have irreproducible empirical findings because of random or systematic error” (Open Science Collaboration 2015, p. 943). Random error as a source of lack of replicability is to be expected. Of course, random error can be reduced and replicability increased by using more reliable measures and larger samples, among other things.
In some cases, results are not replicable because of fraud. According to Van Noorden (2023), around .75% of all published articles in business are likely paper mill products—mass-produced, low-quality, and fabricated research articles (Else and Van Noorden 2021, Ro and Leeming 2025). Although this percentage seems low, it is nearly twice as high as in economics, and the percentage of published scientific papers in business and other fields likely produced by paper mills has grown dramatically in the last 15 years (Richardson et al. 2025; Van Noorden 2023). This problem will almost certainly become more serious in the future, fueled by the rapid diffusion of GenAI tools. To reinforce and strengthen research transparency and integrity, the American Marketing Association (AMA) Publications Policy Committee and the current Editors in Chief of all five AMA journals have agreed on a common policy on data availability.”
That makes the 2016 paper particularly difficult to reconcile with the journal’s current standards—and, at minimum, provides a strong basis for a formal investigation into whether correction or retraction is warranted.
Fornell Responds
I sent Fornell this list of failed replications and asked a direct question:
“Given the repeated failures to reproduce the ACSI effect, the undisclosed strategy behind the 518% return, and the launch of an ACSI-branded ETF only weeks later, how do you justify using those extraordinary returns to support an investment thesis that independent studies had repeatedly failed to replicate, and whose real-world implementation has since consistently underperformed its benchmark?”
He provided me with the following statement in response:
“You ask a legitimate and important question as to why the ACSI ETF returns are significantly lower relative to the S&P 500 if compared to the returns reported prior to 2017. The 15 year (2000-2014) cumulative return of 518% is the audited return, which was provided to the editor-in-chief (see the abstract and details in footnote 1 in the 2016 attached article. Mizik and Jacobson also obtain very large positive abnormal returns but conclude that their returns are statistically insignificant. That’s incorrect. See the relevant attached article.
However, markets have changed, with implications that may be the origins of what you are questioning: The era of “the Customer is King”, that began in the 1950’s and lasted well into this century, is over. At least for now. The customer retention exponential effect on profit remains but it is no longer chiefly produced by customer satisfaction: In many markets today, customer retention is increasing while customer satisfaction is decreasing. Profits are at record levels; so is the stock market. Consumer- and equity market concentration, high consumer switching costs and increased seller pricing power all lessen the impact of customer satisfaction on earnings and stock price. As per standard normative economic theory, sellers should not profit at the expense of customers; they should be rewarded for treating them well and punished for treating them badly.
In addition to increased asset concentration, most of the large increases in stock price have occurred in the B2B sectors, especially in tech. ACSI has a relatively minor participation these sectors. Yet, the ACSI ETF is doing quite well even under these circumstances. Once the asset concentration in the S&P 500 is reduced and replaced by the unweighed S&P as a benchmark, the ACSI ETF continues to outperform it – by 23% over the past 2 years. The market concentration in consumer markets and the absence from B2B make it unrealistic to expect much more outperformance than that. I am acutally suprised that ytd, it has outperfomed the traditional S&P500, but that probably has to do with the recent ups and downs of the tech sector.”
Fornell’s explanation offers a hypothesis for why the ETF’s live performance differs so dramatically from the returns reported in the academic research. It does not resolve the central question raised by this article: why the extraordinary abnormal returns reported in the original ACSI research repeatedly disappeared under independent examination, or how outside researchers can validate the 518% result when the trading strategy that produced it remains undisclosed.